
Ink and Identity: How Politics, Class and Age Drive the Trends for Tattoos

‘24
By: Atyeo Thomas du Toit

72% of 18-24 year olds have considered getting a tattoo, but only 28% have gone through with it.
Younger people have historically been perceived to be more reckless, and thus more likely to get tattoos without fully thinking through the future. This cohort, however, is less likely to have tattoos than any other age group until 55-64 years old, with 25-34 year olds almost twice as likely to have tattoos.
So – what has contributed to this change in behaviour? We will take an in-depth look at our polling to show the social, economic, cultural and geographic determinants of tattoo perceptions and uptake in Britain.
The Politics of Tattoos
Let’s first examine whether political views affect views of tattoos in the UK. We asked how voters of different parties would feel if they saw a list of workers with visible tattoos.
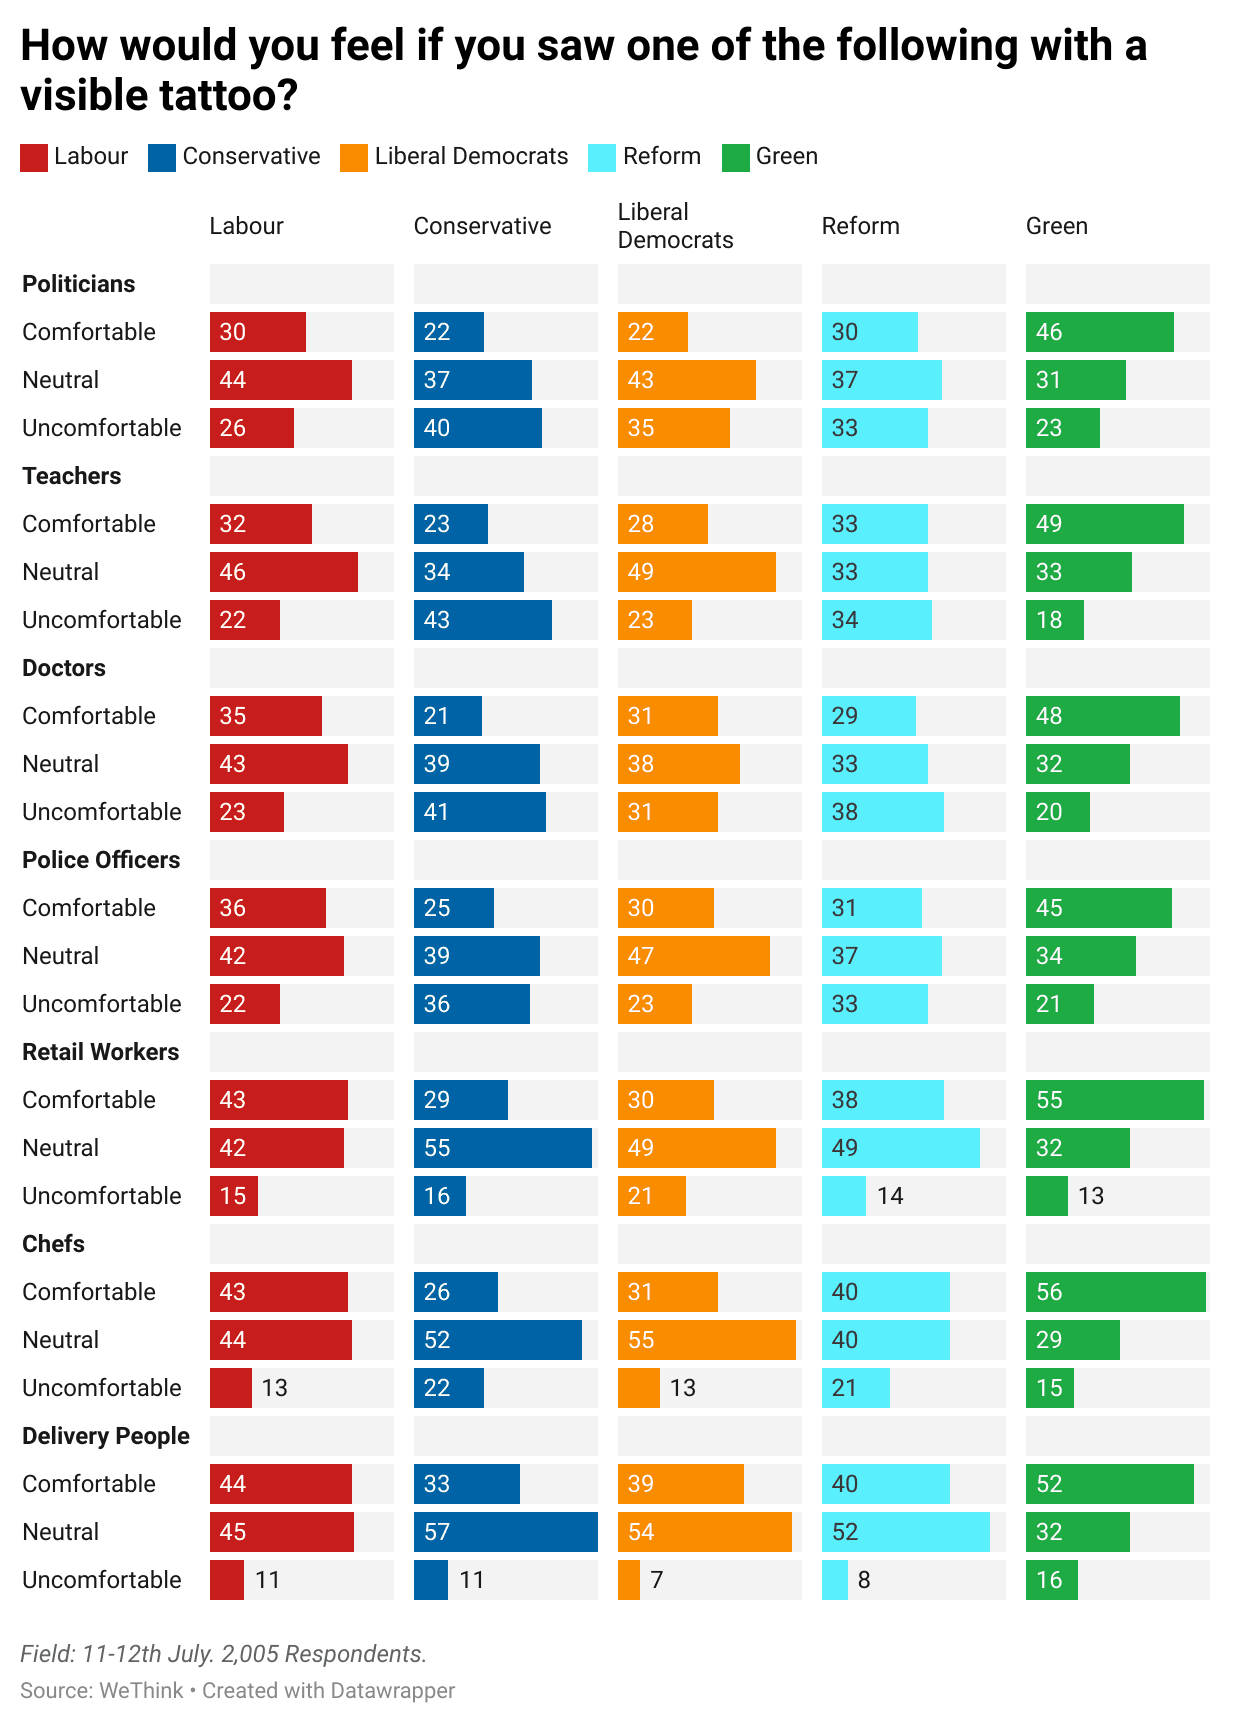
The results suggest that Green voters are the most accepting of tattoos across the board, whilst the Conservatives and Liberal Democrats are the most uncomfortable. Across the dataset, those jobs that are considered more ‘working class’, such as delivery people, are the least likely to make people uncomfortable with visible tattoos.
Public service jobs like Politicians, Doctors, Police, and Teachers, are closer, with much more people feeling uncomfortable if they saw them with a visible tattoo. Despite this, if we combine those who feel comfortable and neutral, 72% of Brits would not react negatively seeing a politician with visible tattoos.
How does Social Class affect Tattoos?
This brings us to social class. Our polling found that as you go down the class system, more people have both gotten tattoos, and considered them at some point.
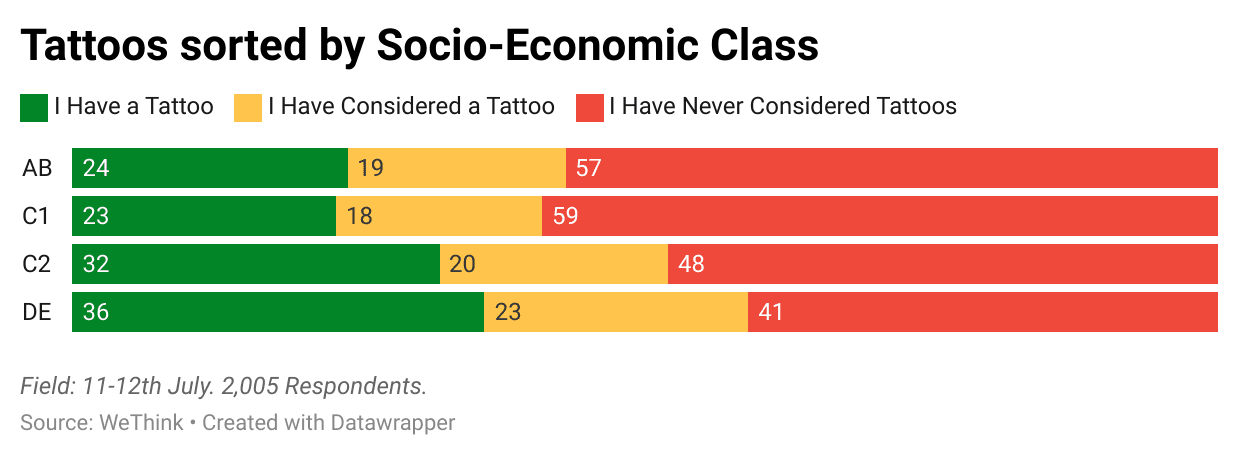
Our polling was prompted by James Austin’s (@JamesDAustin) reflections on watching football in a pub, where he considered why people got tattoos: ‘[I] think it’s a real class thing…’. The results seem to confirm this – DE classes are 1.5x more likely to have tattoos than AB classes.
This trend also translates into their perceptions of tattoos: when asked their first reactions to seeing a visible tattoo, 26% responded ‘Negative’, ‘Uncomfortable’, or ‘Intimidated’. For DE classes, this was halved to 13%. Positive responses of ‘Positive’, ‘Impressed’, or ‘Curious’ sat at 26% for AB classes, compared to 38% for DE classes.
Class therefore is an element in who decides to get tattoos, with almost 1 in 5 (18%) of DE respondents claiming they had chosen to get a tattoo because ‘it looked good on other people’, implying the exposure to more tattoos in daily life influenced their opinions and likelihood of getting tattoos.
The Age Factor
As discussed in the beginning of this piece, age is a fascinating divide in the perceptions and uptake of tattoos in the UK.
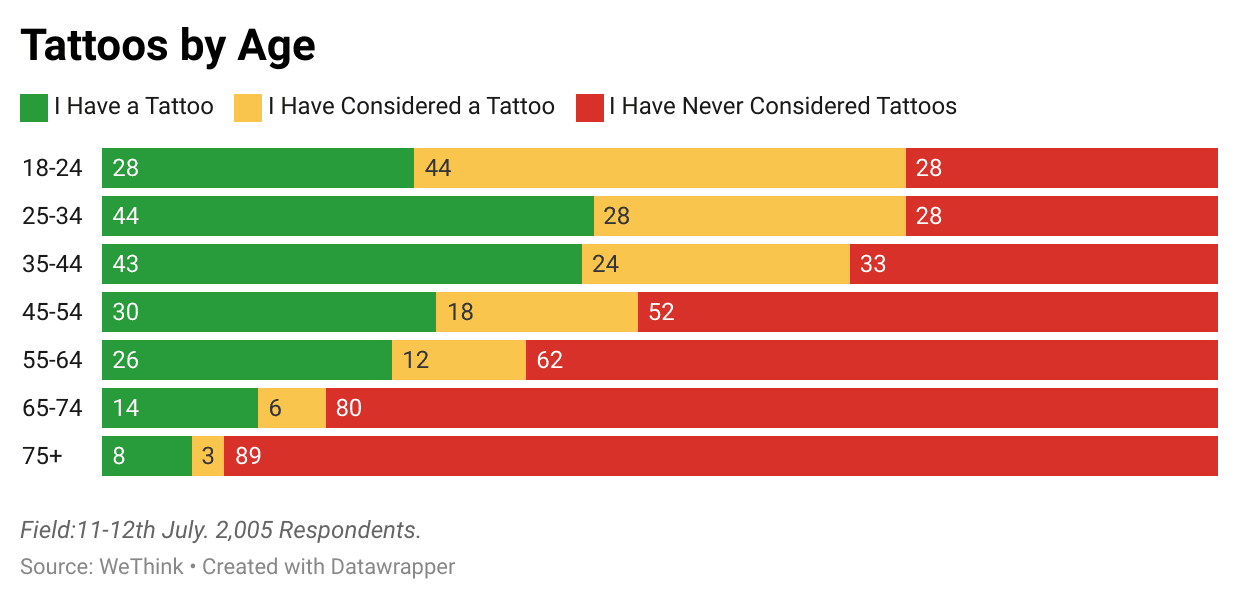
18-24 year olds were amongst the most considered in our dataset – they had thought most about getting tattoos, but were the least likely to go through with it after consideration.
There are many reasons behind this caution – the highest being an unreadiness to commit (24%), whilst the financial troubles they have lived through mean 15% could not afford it. Social attitudes weighed on the hearts of 17% of 18-24 year olds, who decided to forego them because they were worried about how their friends, family, and employers would view them.
This goes hand in hand with their high belief that visible tattoos make someone less hireable, with only 65+ year olds believing more strongly than them. Social attitudes of the older generations have influenced their considered rejection of tattoos, though if they follow the trend of current 25-34 year olds, they may discover that attitudes have shifted in the workplace, and thus there may be an increase in tattoo uptake as a result.
This will be especially prevalent as those younger generations (25-44) move into higher positions in companies, bringing their opinions with them, and thus likely further weakening the workplace discrimination of people with visible tattoos.
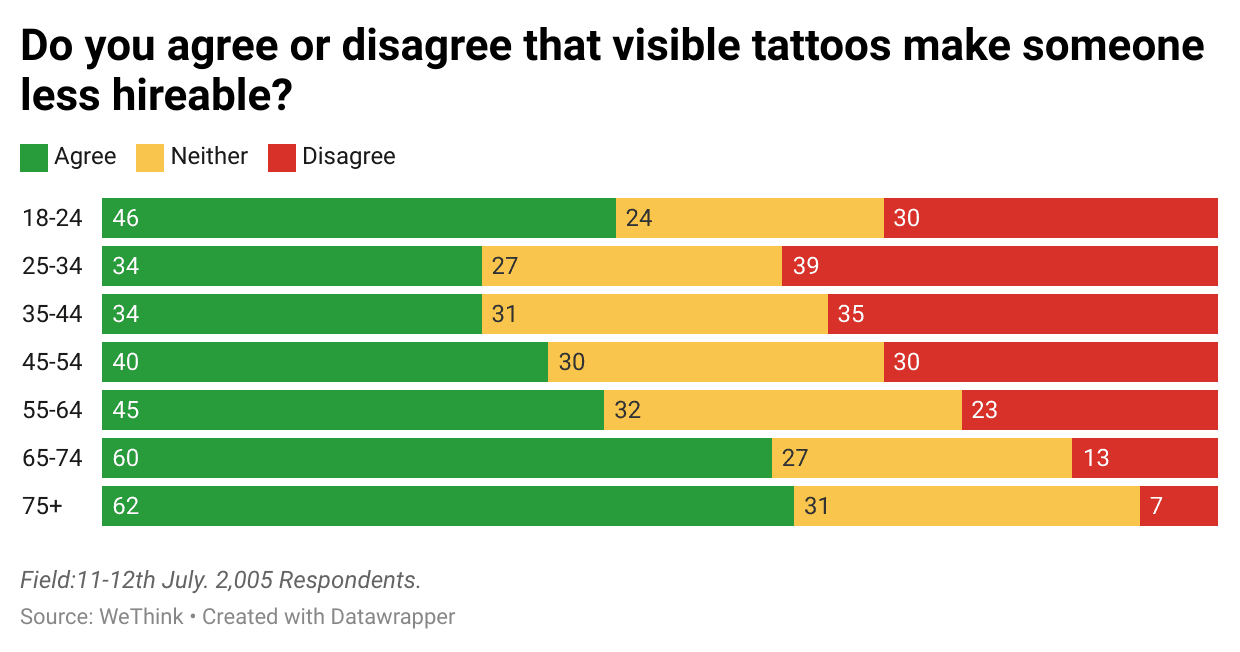
Older people are much more likely to view tattoos badly, with a whopping 44% of 75+ year olds feeling ‘Negative’, ‘Uncomfortable’, or ‘Intimidated’ by a person with visible tattoos, compared to just 8% of 25-34 year olds. When these younger age groups get into positions of power, the cultural shift away from tattoos as undesirable and scary will accelerate even faster.
The Geographic Dynamic
Below is a map showing where people who have a tattoo are most likely to live. We see that the North East has the largest proportion of the population tattooed, compared to the South East, which has the least, as well as the lowest proportion to even consider tattoos at 46%.
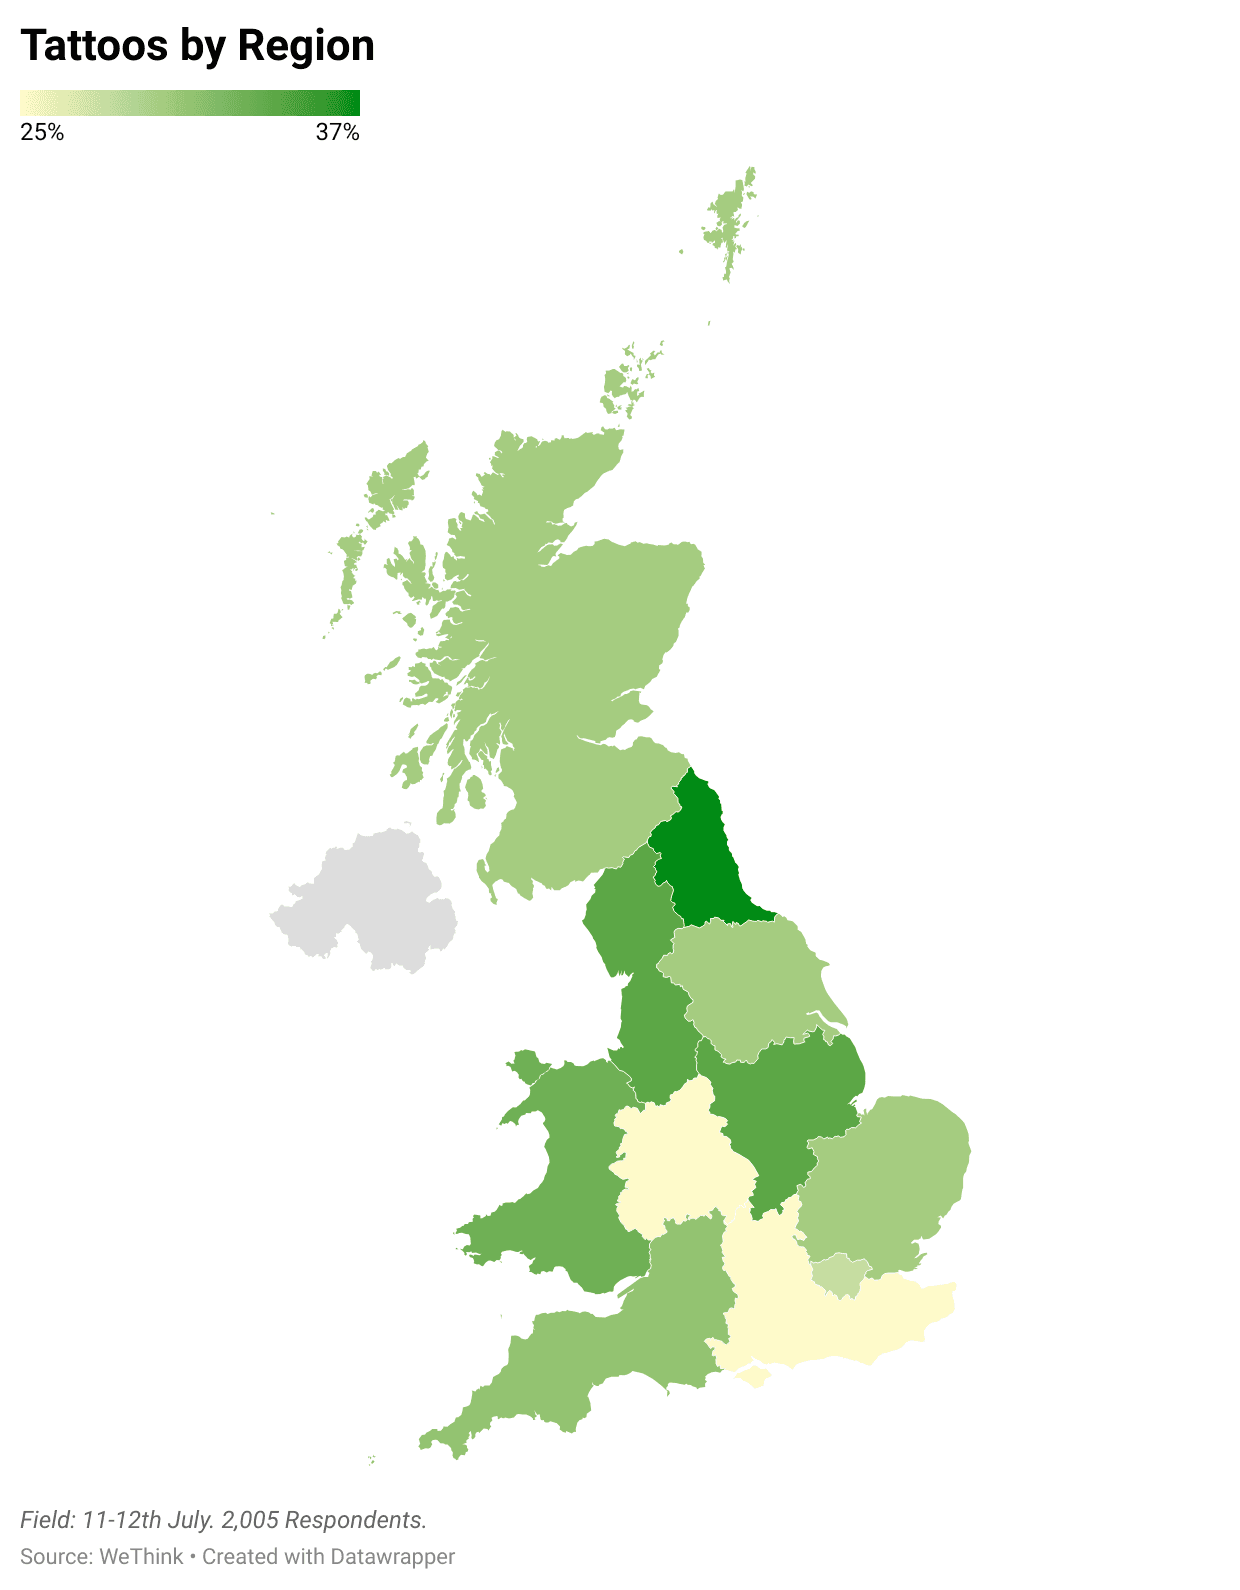
Interestingly, London has the third lowest proportion of the population with tattoos (28%), whilst the second having the second highest proportion of those who considered getting one (55%). The regional results are likely the combination of class based beliefs and the worry of how employers will see someone with a visible tattoo, though this will change quickly as discussed earlier with demographic change.
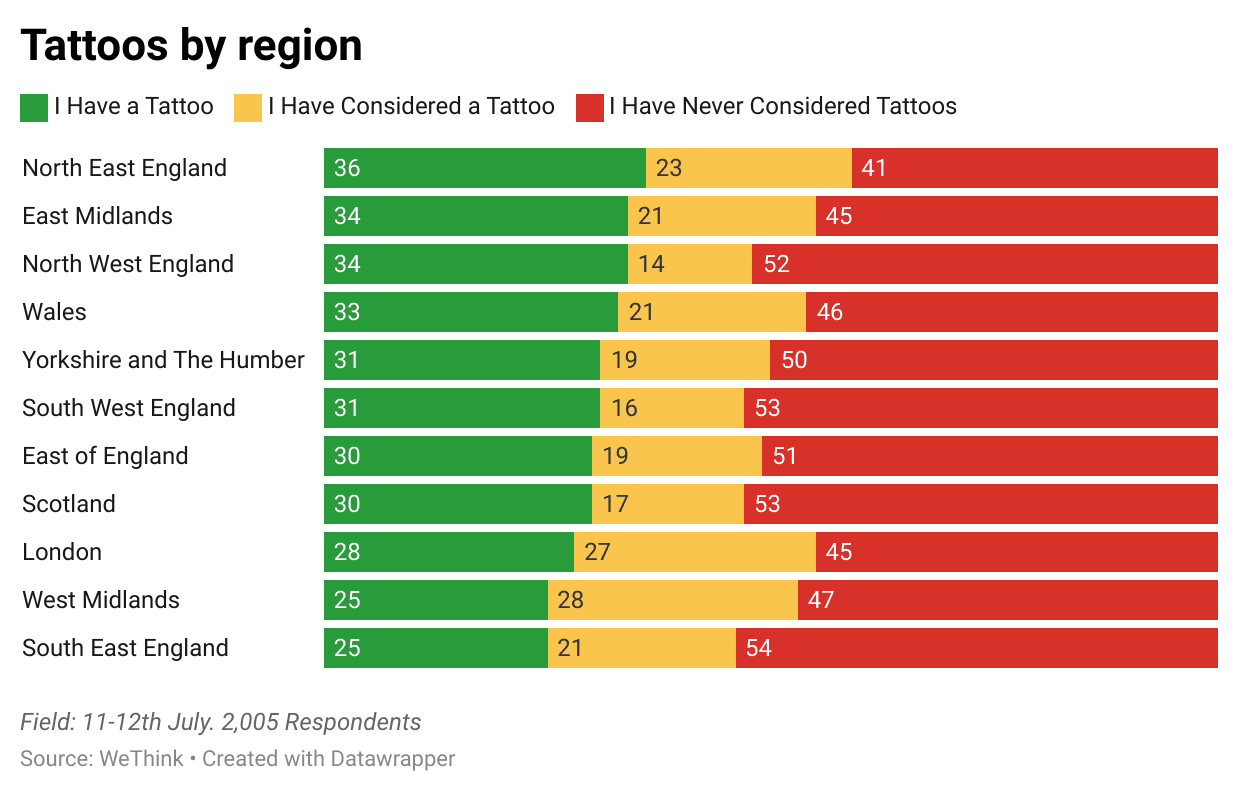
At a national level, the Welsh are the most likely to have tattoos (33%), whilst England and Scotland are slightly behind at 30% respectively. At this level, Scotland are the only nation in Great Britain that have a majority who have never considered getting tattoos at 53%, compared to 49% and 45% for England and Wales respectively.
What can we draw from this data?
What can we draw from this data? Politically, tattoos do not have the intimidating effect that they once did, though a significant amount of the electorate would still react negatively to a politician with them. Cultural differences have led to a strong correlation between social class and geography, and getting tattoos, though this starts to break down with the younger generation.
As the young grow into positions of power in companies, society, and politics, their changing beliefs of tattoos will lead to a larger cultural shift away from the negative perceptions that many older generations hold today. It’s yet to be seen whether the current 18-24 year old cohort will continue this trend, but it’s likely after they have experienced the world of work.
‘24
By: Atyeo Thomas du Toit


Sign up for our newsletter
Stay up-to-date with the latest poll results and insights.