
WeThink MRP: Historical low for the Conservatives?

‘24
By: Jamie Furlong

Our MRP headlines:
- Labour are on course to achieve the biggest majority recorded since universal suffrage in the UK, on 465 seats compared to 76 for the Tories
- Some of the biggest Conservative losses come in their rural and small-town heartlands, where they will hold only 25 of their 114 seats
- Liz Truss is set to lose her rural seat of South West Norfolk to Labour, where she currently has a 51-point majority
- In Scotland, the SNP are estimated to finish on 29 seats with Labour on 23, but some 20 seats are on a knife-edge between the two parties
- The Greens are predicted to make two gains, including North Herefordshire, giving them three seats in total
A historical low for the Conservatives
The MRP from WeThink, in collaboration with The Economist, offers further evidence that the upcoming General Election is likely to mark a historical low point for the Conservative Party.
Our novel analysis shows the party is set to lose swathes of seats to Labour in its own historical strongholds, including Liz Truss’s seat of South West Norfolk, where they currently have a 51-point majority.
Overall, the model estimates that Labour will finish the night on 465 seats with the Conservatives reduced to just 76 – the biggest landslide in British post-universal suffrage electoral history.
The election could mark new ground for the Labour Party, who are predicted to win seats in parts of Middle England – from Windsor to Hexham - that, even under Tony Blair, they were never able to capture. Disproportionate swings to Labour in seats with substantial Tory majorities make almost any Conservative seat vulnerable.
In Scotland, the SNP are estimated to finish on 29 seats, holding onto 26, and gaining an additional three from the Conservatives. Labour are predicted to gain 19 seats from the SNP and three from the Tories, ending up on 23.
The Liberal Democrats total five seats, courtesy of three gains from the SNP. The Conservatives are set to lose all six seats held – three to Labour with three going to the SNP. The result could be even better for Labour in Scotland. We predict that 20 seats are on a knife-edge, with majorities of less than 5%. In 13 of these seats, the SNP are predicted winners with Labour in second place, meaning very marginal shifts in votes to Labour could see them gain more than the predicted 23 seats.
For the Greens, there is reason to be cheerful, with the party set to achieve a record three MPs in Parliament. In Brighton Pavilion, we predict a comfortable hold for the party, with much narrower gains in Bristol Central and North Herefordshire. The party could make a fourth gain in Waveney Valley, which is currently a ‘toss-up’, with the Conservatives predicted to win on just 29.5% of the vote versus 29% for the Greens.
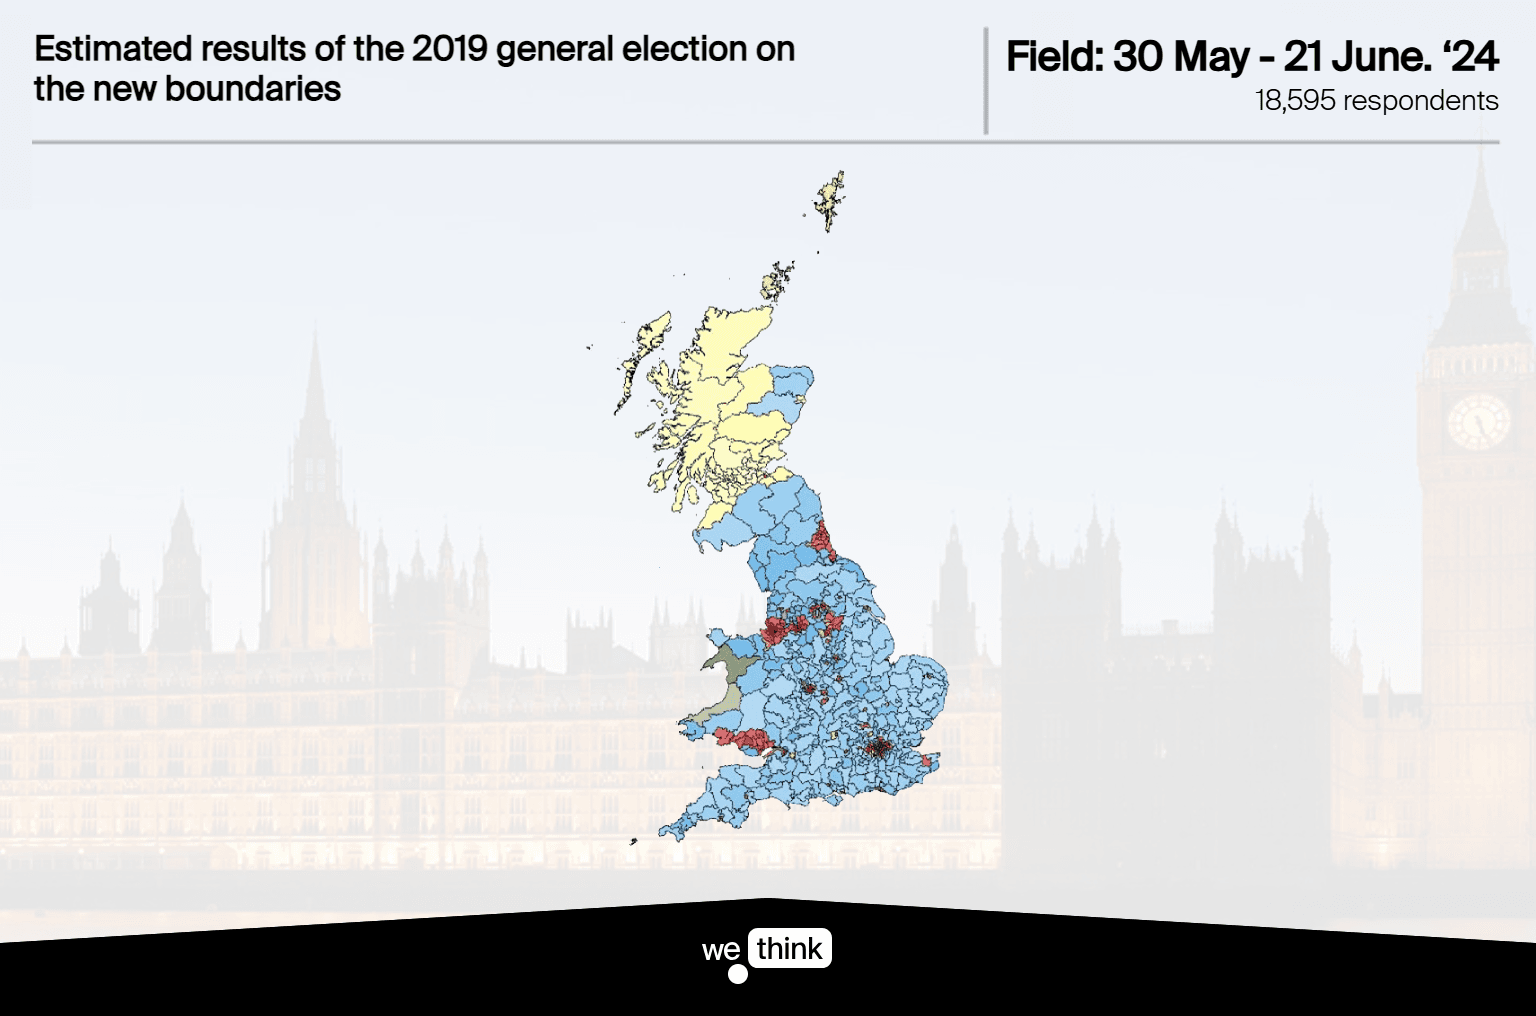
Fig 1. Estimated results of the 2019 general election on the new boundaries (Rallings & Thrasher)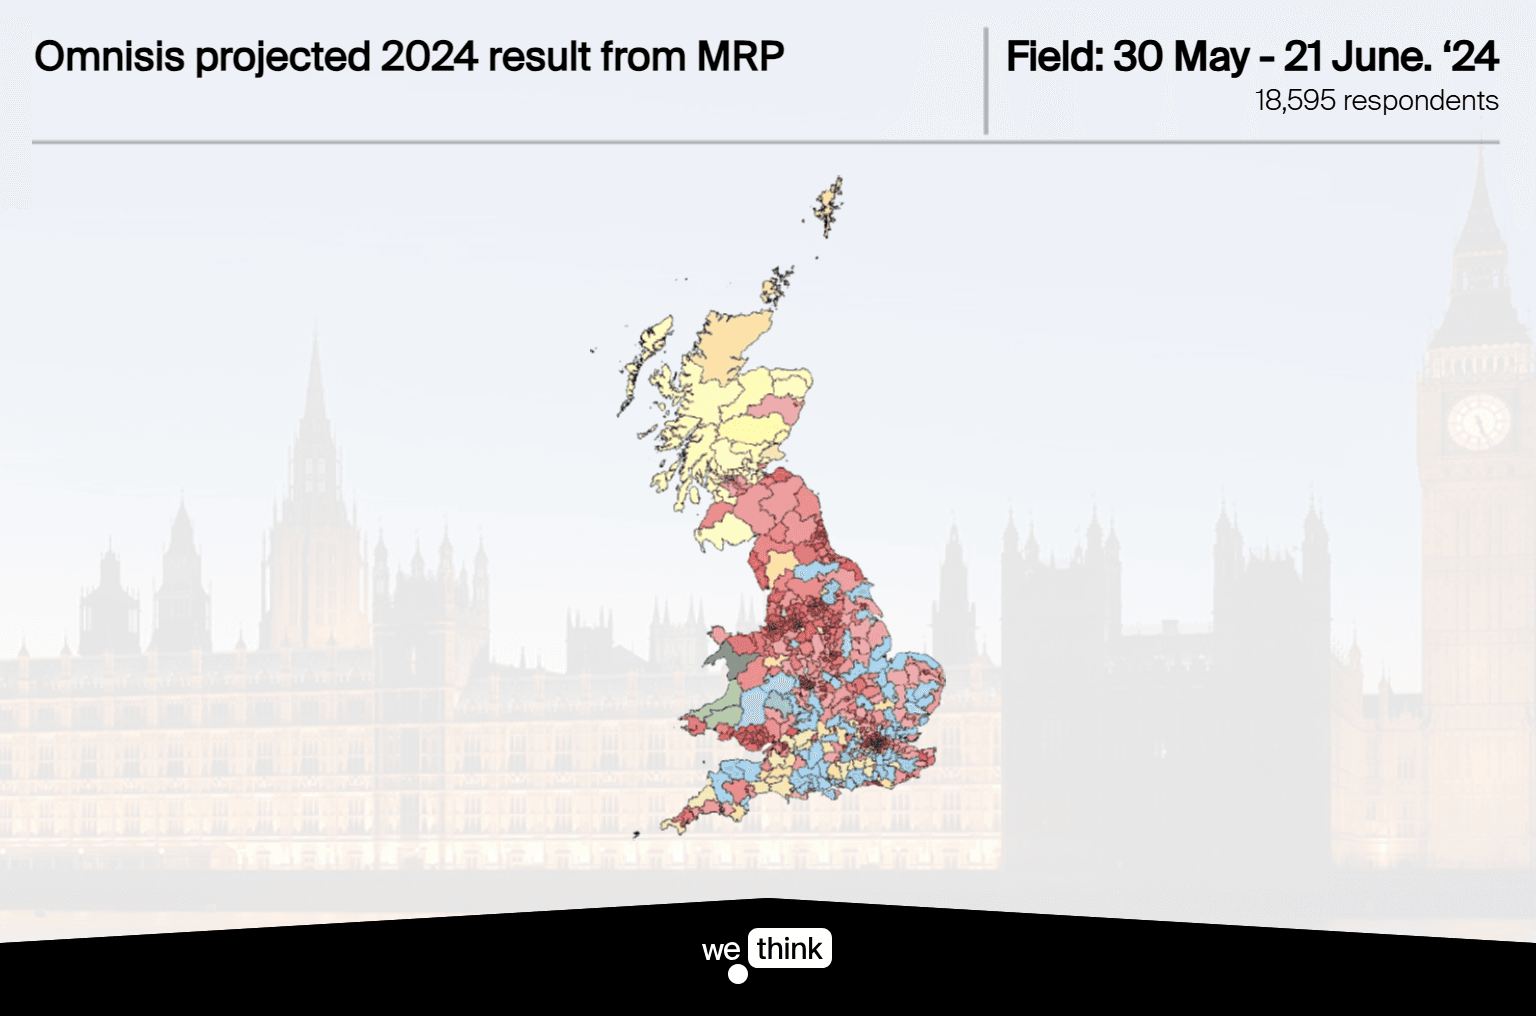
Fig 2. WeThink / Economist projected 2024 result from MRP
Looking at the movement in voter numbers from each party - from the 2019 general election to the 2024 projected results - gives us a good insight in how voter allegiance has shifted.
This chart visualises the dynamic movement of votes between parties.
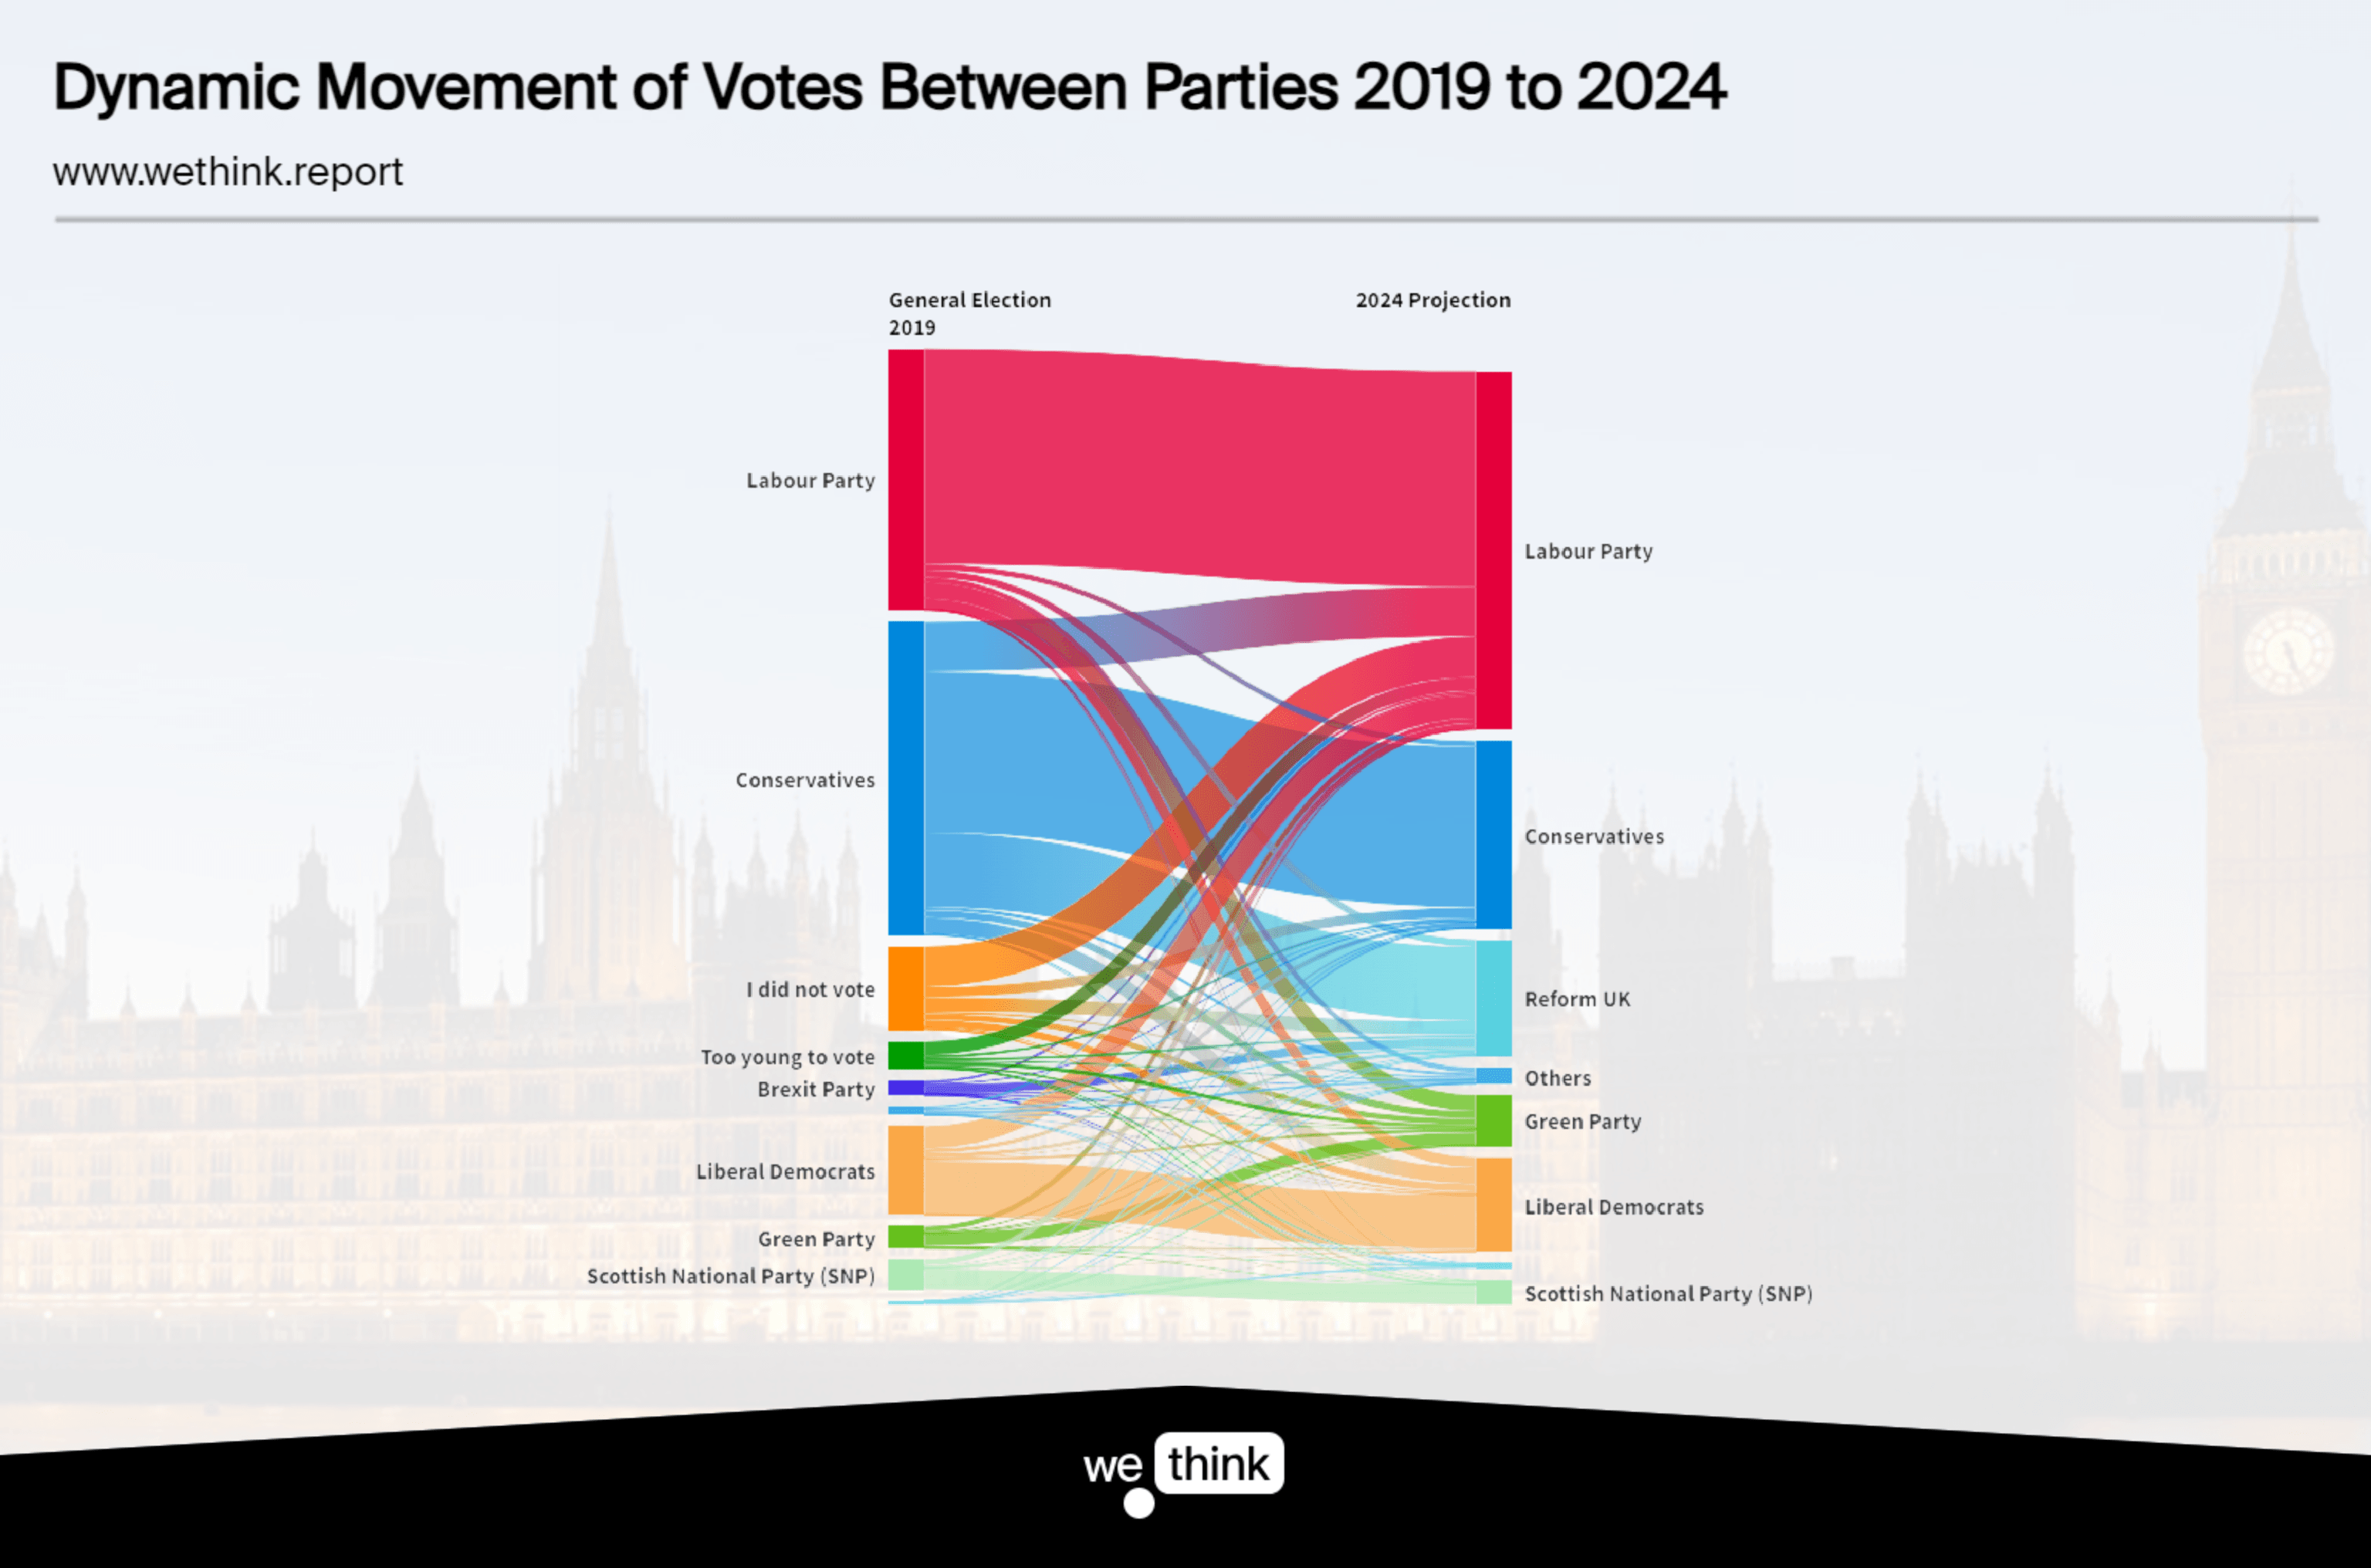
It shows that:
- 50% of those who were too young to vote in 2019 now intend to vote Labour
- 50% of those who did not vote in 2019 intend to vote Labour
- 25% of those who voted Liberal Democrat in 2019 now intend to vote Labour
- 65% of those who were Brexit Party voters in 2019 have segued directly to be Reform UK voters
- Whilst almost 25% 2019 Conservative voters are heading into that Reform UK camp too.
And surely, a key factor will be the 1.75 million voters moving from the Conservatives to Labour - these last two are the decisive factors that are going to be driving the election result.
These movements highlight the fluid nature of political allegiance, driven by the ever evolving political landscapes, changing voter priorities, and our recent socio-political climate.
Constituency groups
To better understand what types of constituencies are likely to see the biggest changes at this election, we have grouped constituencies in England and Wales into five groups.
Scotland is not included in this analysis as there is limited demographic data available for Scottish constituencies. Of course, not every constituency is a perfect fit and there are shared characteristics across the constituency types.
But, generally in each group, constituencies share common characteristics based on the demographic traits of people that live there, region and results at recent general elections (as well as the EU referendum). A summary of the five groups is provided in the table below:
Table 1. The groups of constituencies used in this analysis
The Tory collapse in their rural heartlands
At the 2019 election, the Conservatives were completely dominant in three of these five constituency groups – ‘The Shires’, ‘Comfortable and Commuting’ and ‘Marginal and Mixed’, giving them a clear majority across England and Wales.
Yet, our projections for 2024 show that the Tories are collapsing in their own rural and small town heartlands. In ‘The Shires’, where in 2019 the party held 114 of 116 seats, we estimate in Tory-held seats an average Tory to Labour swing of +21, leaving the party holding on to just 25 seats.
These seats are typically middle class, overwhelmingly white with older populations and many homeowners. Many are places where the Conservatives have long held power, even throughout the Blair years when Labour extended their reach into the constituencies of Middle England.
In Hexham, Northumberland, Labour are likely to win for the first time, after 100 years of Conservative dominance. In South West Norfolk, Labour are predicted to unseat former Prime Minister, Liz Truss, overturning a majority of over 26,000.
Some of the most remarkable stories on election night could come from Thirsk and Malton, Grantham and Bourne, Bexhill and Battle and Skipton and Ripon. The list could go on.
Labour’s disproportionate swings
For Labour, what matters most is that they see disproportionate swings to them in the kinds of areas where there are many Tory-held seats in reach.
In 2019, and to some extent in 2017, Labour were hindered by the inefficient distribution of their votes, piling up majorities in big cities and losing support not only in their own heartlands but in towns that have historically been marginal – seats that we have long thought for Labour to win an election, they need to win.
Many of these seats are what we call ‘Marginal and Mixed’, with a mix of demographics that is often representative of the population. In 2019, the Conservatives held 111 out of 136 of these constituencies. In 2024, this is where we estimate Labour’s biggest number of seat gains to come from.
On a +21 swing from the Conservatives, our MRP indicates that 105 of the 111 Tory-held seats will end up in Labour’s hands. Some seats, such as Calder Valley, are notoriously marginal; others, such as Daventry and Tamworth, the Tories look set to lose massive majorities.
Even within areas where the Tories hold far fewer seats – ‘Post-industrial diversity’ and ‘Cosmopolitan inequality’ – Labour are set to make more seat gains from disproportionate swings in seats held by the Conservatives. In the ‘Post-industrial diversity’ seats, the swing from the Tories to Labour is +12, but in those seats held by the Tories, this rises to +18.
That enables the party to gain all 23 Tory-held seats and rebuild support in places like Stoke-on-Trent Central and Bolsover, which prior to the collapse of parts of the Red Wall, were more solidly Labour.
Windsor and Tatton – new Labour territory?
The final set of seats that will shape this election in England and Wales are those we call ‘Comfortable and commuting’. These are generally affluent, predominantly in Southern England, with highly-qualified populations, many of whom might commute into London or elsewhere.
Perhaps surprisingly, we predict the Conservatives to hold on to a slightly higher percentage (39%) of their seats here than in the ‘The Shires’ (22%). Nonetheless, there is nothing positive here for the Tories, with 37 seats heading to Labour, including previously thought impossible gains in Windsor and Tatton.
Many of the 31 Liberal Democrat gains come in previously held seats – Eastleigh, Harrogate and Knaresborough and Hazel Grove – though others mark new territory, including David Cameron’s former constituency of Witney in Oxfordshire.
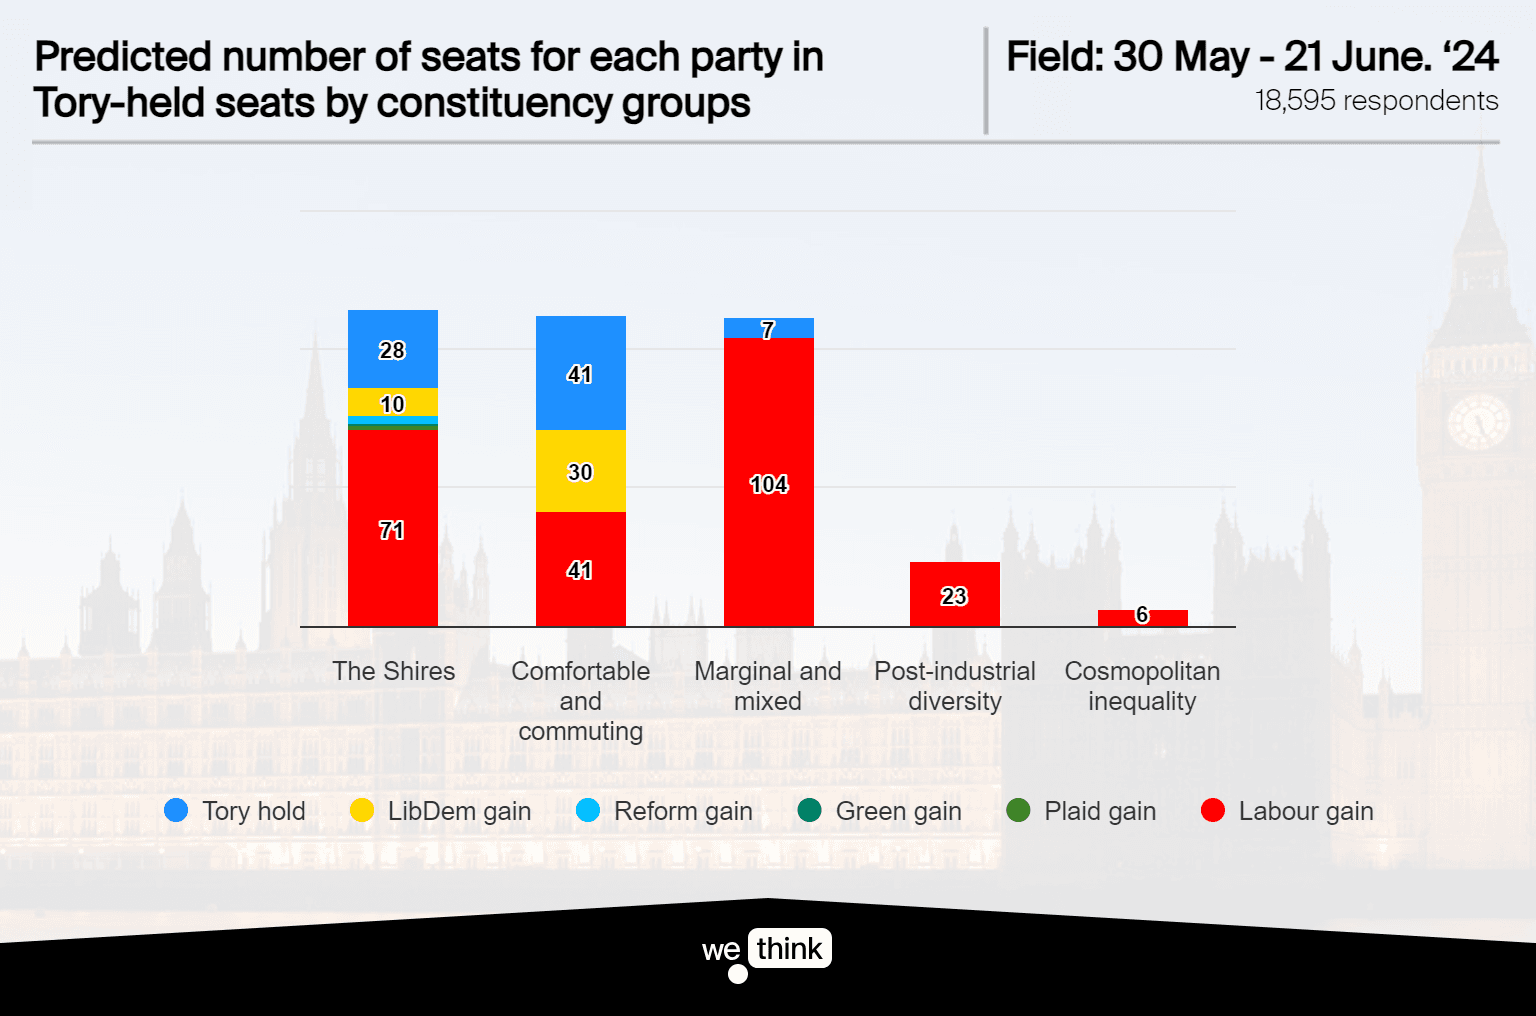
Table 2. Predicted Tory to Labour and Tory to Liberal Democrat swings by constituency groups
A repeat of 1997?
The natural comparison for the upcoming 2024 general election is, of course, 1997, when Labour achieved a landslide win by reaching into more middle-class parts of England and Wales, whilst retaining support in its post-industrial and city heartlands.
On the surface, the geography of this election seems similar: Labour are expected to rebuild ‘The Red Wall’ whilst gaining ground in Middle England. Yet that would ignore how the distribution of support for the two parties has changed since 1997.
Whereas in 1997, Labour held some of its biggest majorities in post-industrial towns in the Red Wall; in 2024, these are likely to be narrower gains compared to their dominance in bigger cities.
This is clear if we compare vote shares in 1997 and 2024 across constituencies grouped into deciles by the proportion employed in working class occupations. In 1997, in the 10% most working-class constituencies, Labour achieved an average vote share of 63% compared to 38% in the least working-class seats.
In 2024, our model estimates that Labour will do marginally better in the most working-class seats, achieving 52% of the vote compared to 41% in the least working class. For the Tories, their predicted performance in the more working-class constituencies is quite similar to 1997, despite their lower predicted vote share overall.
However, in the least working-class constituencies, they have haemorrhaged votes. In 1997, they were tied at 38% with Labour; in 2024 they are estimated to be some 17 points – further evidence of the Conservative collapse across Middle England.
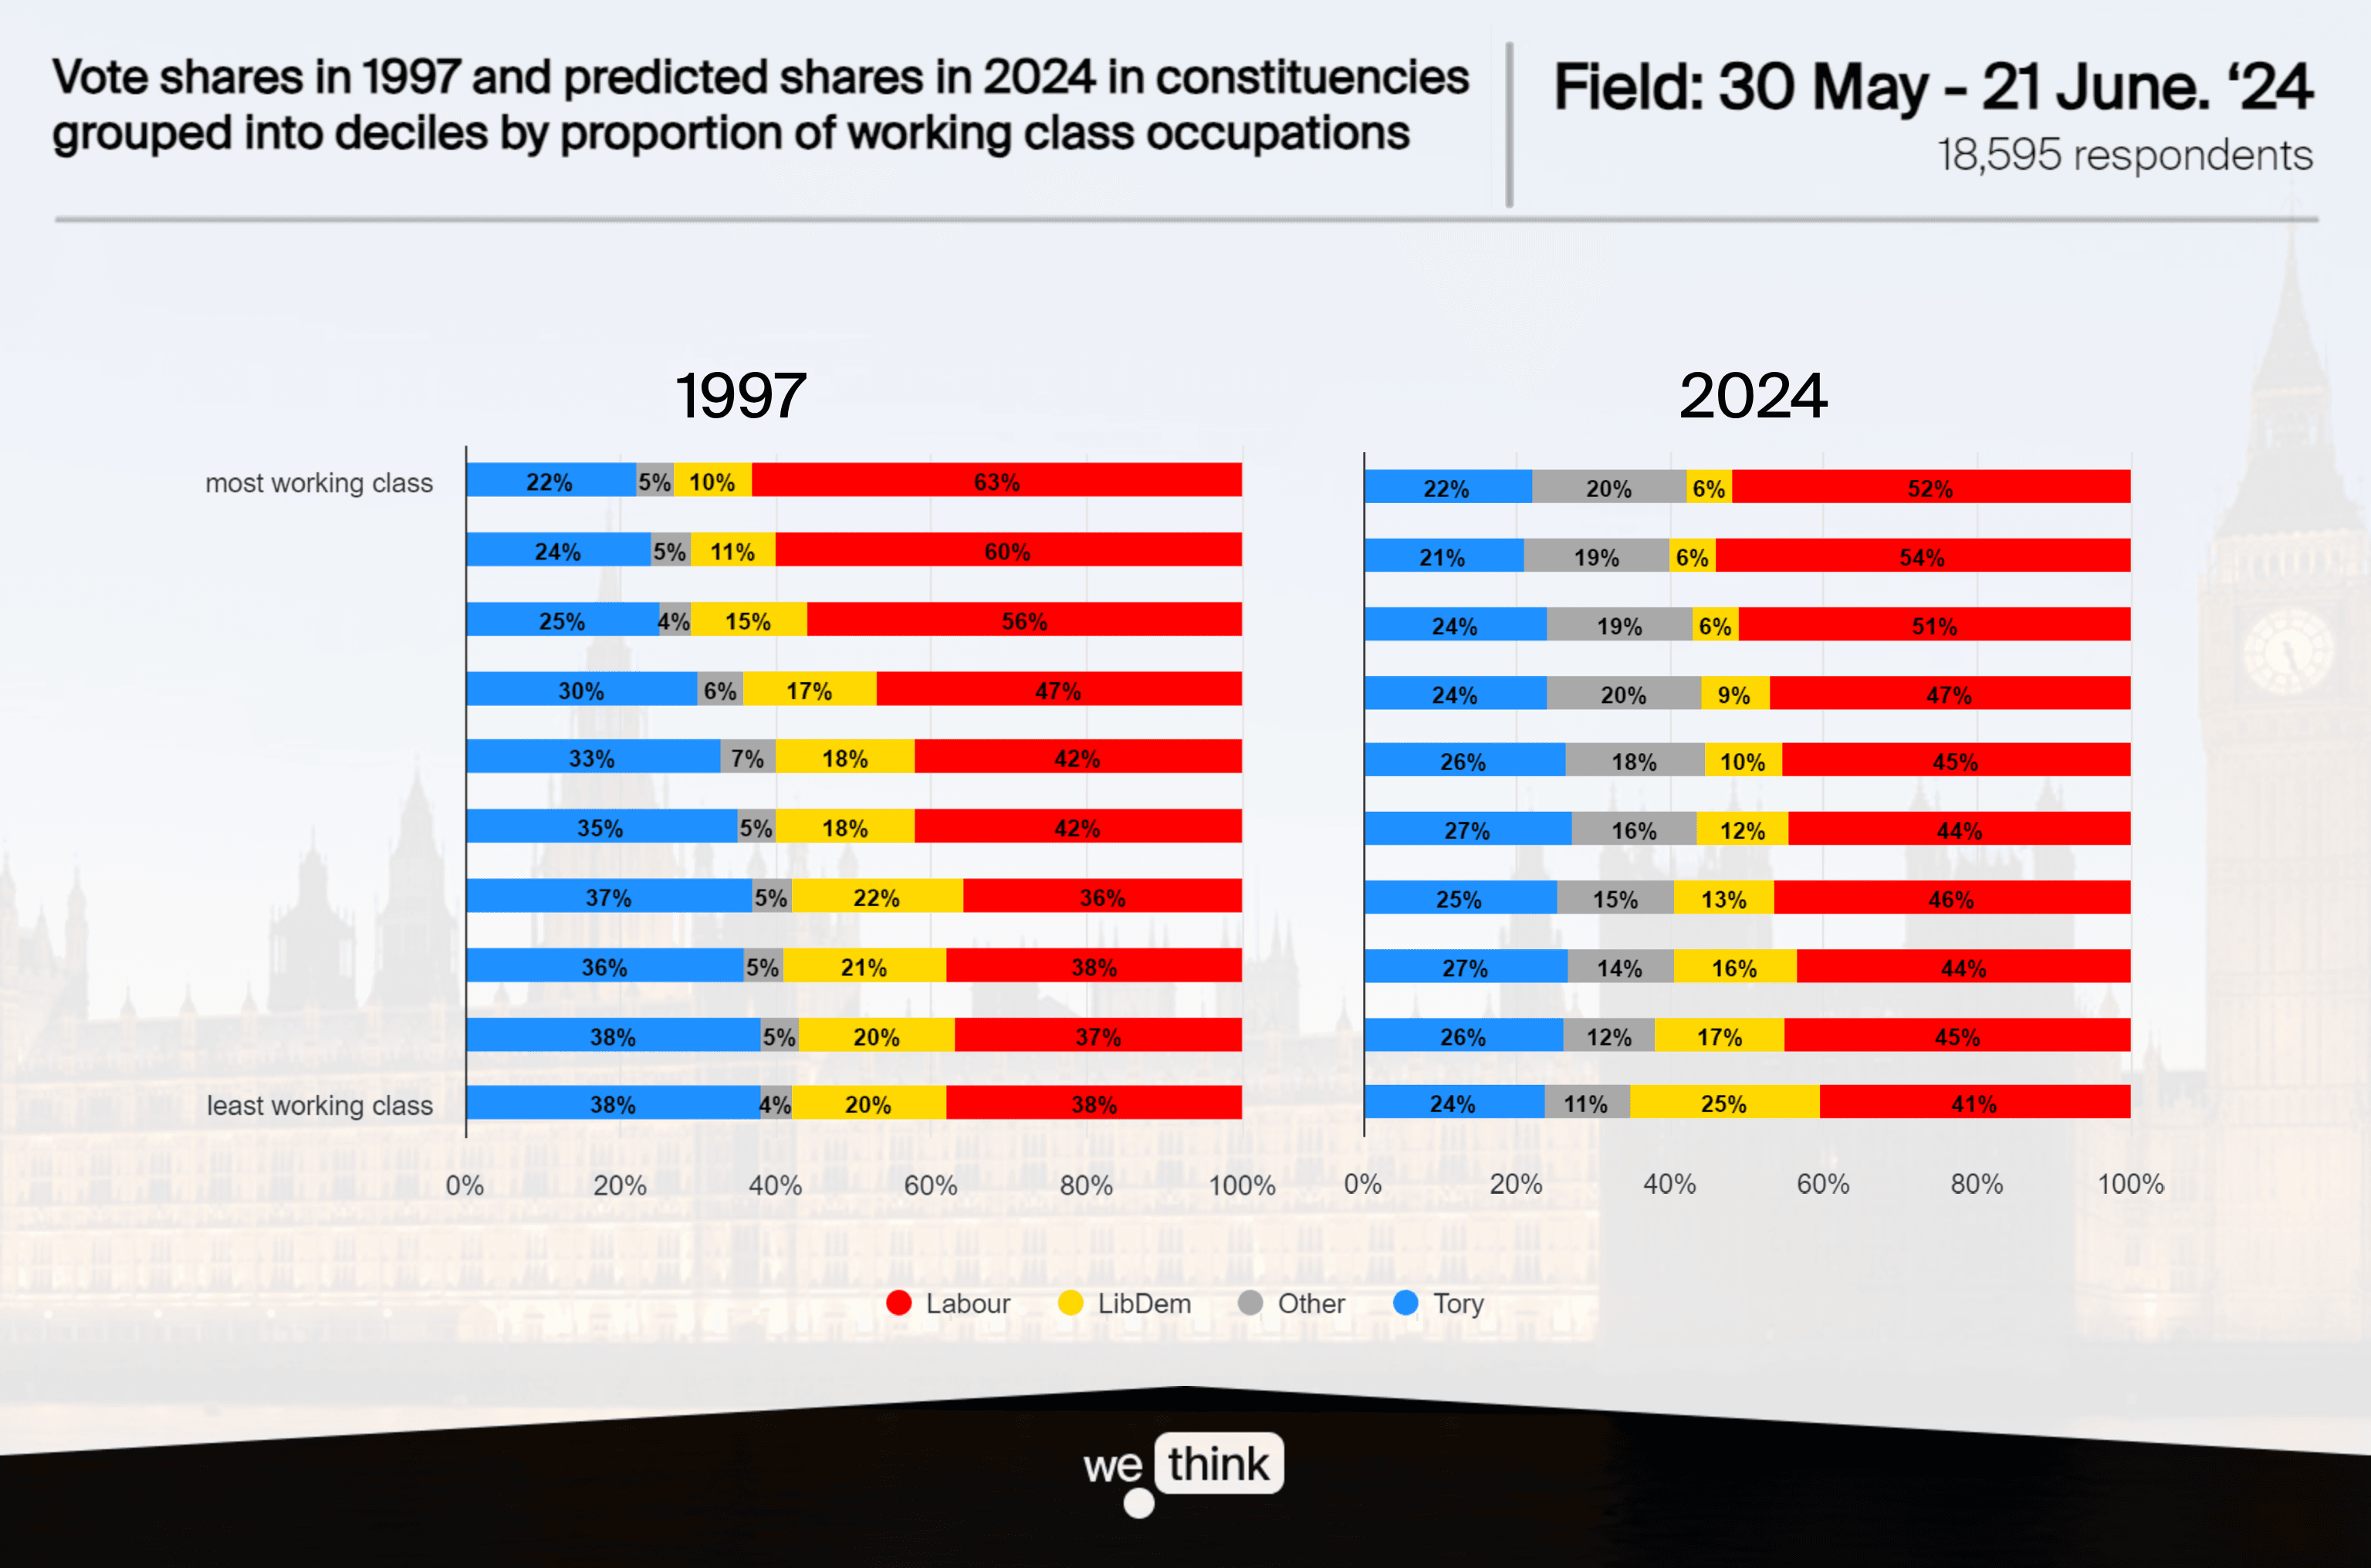
Fig 3. Vote shares in 1997 and predicted shares in 2024 in constituencies grouped into deciles by proportion of working class occupations
While Labour’s support is, relatively speaking, not as rooted in working class areas as in 1997, the pattern in the most economically deprived areas is remarkably similar to 1997.
In fact, in the top 70% of constituencies ranked by levels of unemployment, the party is predicted to achieve almost identical vote shares to 1997. In the most deprived of all (i.e. the top 10% by unemployment), the Labour average vote share of 66% and the Tory average of 16% is identical to in 1997. Labour remain dominant in the poorest communities in England and Wales.
In areas at the other end of the spectrum – those with the lowest levels of unemployment – the Conservatives have much less support than in 1997. Even in that landslide Labour victory, they were able to achieve a plurality of the vote across constituencies with particularly lower levels of unemployment. At this election, the two parties are currently more or less neck-and-neck achieving around a third of the vote in these least deprived parts of England and Wales.

Fig 4. Vote shares in 1997 and predicted shares in 2024 in constituencies grouped into deciles by unemployment
In an election where Labour’s likely landslide is going to see them reach into wealthy, rural Tory heartlands at the same time as regaining seats across post-industrial towns, any changes to the geographical structure of their support is likely to be overlooked, particularly when an easy comparison with 1997 can be made.
But there are differences, notably that Labour’s support will be less rooted in the most working-class communities, even if they remain as dominant in the poorest areas of England and Wales. And the strides into Middle England, potentially taking places like Windsor and Tattton, are unprecedented.
Have a go with our Hex Map projection
We've partnered with Election Maps (electionmaps.uk) to produce an interactive hex map projection and of the nation so you can see how Britain voted in 2019 compared to our 2024 projection.
And here's how Parliament would shape up...
Main image credit: Picture by Lauren Hurley / No 10 Downing Street
Link to the methodology + data is here
https://docs.google.com/spreadsheets/d/1cd2korBm0QtEUQs5SY51Fs_xHzX1XLGqlgNXza8JNYU/edit?gid=1916899345#gid=1916899345
‘24
By: Jamie Furlong


Sign up for our newsletter
Stay up-to-date with the latest poll results and insights.